
Dadai:2017- Donald Trump veracity - composite graph.png

Uaschbringlischi Dadai (2.775 × 1.750 Pixels, Dadaigreß: 141 KB, MIME-Type: image/png)

|
Dieses Bild des Typs Graph sollte als Vektorgrafik im SVG-Format neu erstellt werden. Vektorformate haben zahlreiche Vorteile; weitere Information unter Commons:Media for cleanup. Wenn dir eine SVG-Version dieses Bildes vorliegt, so lade diese bitte hoch. Nach dem Hochladen der Datei ist diese Vorlage auf der aktuellen Bildbeschreibungsseite durch die Vorlage {{Vector version available}}, oder kürzer {{Vva}}, zu ersetzen. Es ist empfohlen die neue SVG-Datei „2017- Donald Trump veracity - composite graph.svg“ zu nennen – dann benötigt die Vorlage vector version available (bzw. vva) keinen Parameter.
|
Iwwabligg
| Bschraiwung |
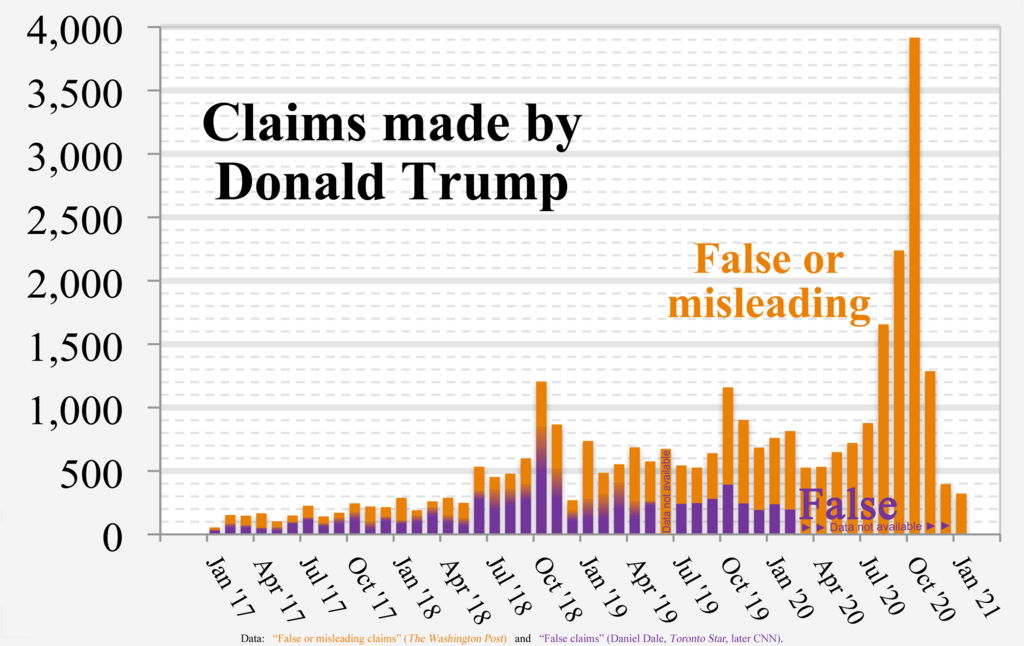
English: Chart of Donald Trump's “False or misleading claims” (The Washington Post) and “False claims” by Daniel Dale (Toronto Star, later CNN)
Technical details:
|
| Dadum | |
| Gwell | Aischenes Weag |
| Schraiwa | RCraig09 |
| Andere Versionen |
 |
Source data
- Data used to form fact check from The Washington Post is in image description page for File:2017- Donald Trump - graph - false or misleading claims.png
- Data used to form Toronto Star / CNN graph is in collapsible text:
- Versions 1 through 4:
| Click at right to show/hide data for Toronto Star / CNN portions (center of "error bars" in Versions 1-4) |
|---|
|
Month False statements |
- Version 5+:
| Click at right to show/hide data for Toronto Star / CNN portions (below, inside, and above Gradient regions in Version 5) |
|---|
|
Each three of the following data items are "stacked" (violet, below gradient, below orange) to form a full-height column. Month MIN GRADIENT WashPost |
Bwillischung
- Des Weag deaf vunda
- Deele – Die Eawed, kobiare, vadeele unn waidagewwe
- nai zoamemigse – Onde Eawed ännare unn schaffe
- Unnade Bedinguge:
- Zuschraiwung – Mugschde Noame vunde Audore odda Lizensgewwa inde Aad unn Wais, wieses wolln waidagewwe (awwa nedd so, dasses so ausseje dud, als deda disch odda doi Vawendung vunde Eawed unnaschdidze).
- Waidagawb unna glaische Bdingunge – Wonn oam lizeziade Weag odda den lizeziade Inhald schaffschd, s'nnaschd odda schunschdwie fa aischenes Schaffe vawenne duschd, konschd die naije Weag un Inhalde nua unna Lizenzbedingunge waidagewwe, wu midde denne Lizenzvadräsch do vadreschlisch sinn.
Dadaigschischd
Drigg uffn Zaidpungd zum oazaische, wies doad ausgseje hodd.
| Zaidpungd | Gleenes Bild | Maß | Middawaida | Oißarung | |
|---|---|---|---|---|---|
| agduell | 08:23, 9. Feb 2021 | | 2.775 × 1.750 (141 KB) | RCraig09 | Version 16: Eliminate Oct 2016 as irrelevant date to include. Reduced filesize at tinypng.com |
| 08:08, 9. Feb 2021 |  | 2.775 × 1.750 (140 KB) | RCraig09 | Version 15: Update to include final data for January 2021. Reduced filesize at tinypng.com. | |
| 09:00, 16. Jan 2021 |  | 2.775 × 1.750 (520 KB) | RCraig09 | Version 14: Update to include Washington Post data for Nov and Dec 2020 | |
| 01:32, 6. Jan 2021 |  | 2.775 × 1.750 (588 KB) | RCraig09 | Version 13: Updated to include Washington Post data through October 2020. | |
| 01:39, 21. Dez 2020 |  | 2.775 × 1.750 (495 KB) | RCraig09 | Version 12: Update to include Washington Post data through end of September 2020. | |
| 09:24, 16. Nov 2020 |  | 2.775 × 1.750 (532 KB) | RCraig09 | Version 11: Updating graph to include exact value for August 2020 that no longer involves extrapolation for the last four days of the month. Washington Post added a few more days to their database. | |
| 00:28, 22. Ogd 2020 |  | 2.775 × 1.750 (532 KB) | RCraig09 | Version 10: Update to include Washington Post data for July and August 2020. Had to expand vertical scale to accommodate new high in data value (for August 2020). | |
| 08:43, 13. Jul 2020 |  | 2.775 × 1.750 (522 KB) | RCraig09 | Version 9: updated to include Washington Post data for June 2020. | |
| 08:00, 5. Jun 2020 |  | 2.775 × 1.750 (515 KB) | RCraig09 | Version 8: Updating to include Washington Post data for April and May 2020 | |
| 22:29, 15. Abr 2020 |  | 2.775 × 1.750 (586 KB) | RCraig09 | Version 7: updated to include CNN data for Jan and Feb 2020 |
Dadaivawendung
Die Said vawaisd uff die Dadai:
Globali Dadaivawendung
Die oannare Wikis bnudzn die Dadai:
- Vawendung uff ca.wikipedia.org
- Vawendung uff en.wikipedia.org
- Vawendung uff he.wikipedia.org
- Vawendung uff hy.wikipedia.org
- Vawendung uff ja.wikipedia.org